
A look at oil market supply, demand and development over the next five years
The oil and gas industry is in turmoil. A downturn in crude oil markets has taken a bumpy path, resulting in declining oil prices and leading to deep reductions in capital expenditures. What, then, is the future of oil? Although sizeable capital and operational budget cuts could leave a lasting impact, Deloitte MarketPoint analysis delves into that future to provide beneficial insights, from the sources that cover production shortfalls to how current supply and demand could affect future oil prices.
The Current Downturn
Since mid-2014, the crude oil markets cycle has turned downward, resulting in ever-lower prices, leading to deep CAPEX spending reductions, and creating turmoil across the oil and gas industry. Recently, market prices briefly slipped below $30/barrel—and some analysts are predicting even lower prices while others are arguing for a modest recovery, at least in the near term.
The current downturn has been brought on by a variety of factors, including, but not limited to: the U.S. tight oil revolution; the Organization of Petroleum Exporting Countries’ (OPEC) new strategy, led by Saudi Arabia, to protect market share rather than balance the market; the lifting of sanctions on Iran; growing inventory levels of crude oil and refined products worldwide; and expectations of lower world oil demand growth due to a worldwide economic downturn.
The Potential Recovery
Many views have been expressed about the eventual shape of the oil price recovery: Will markets follow a short “V-shape” recovery, or will a more extended period of soft prices create a “U-shape” price curve? The 2008–2009 period saw a relatively dramatic price and demand decline, falling by 2.3 percent over the two-year period. In response to the demand decline, OPEC reacted with production cuts which supported 2010’s rapid oil price rise, creating the V-shape recovery.
Today’s market decline is associated more with large increases in supply, rather than merely a decline in demand. In marked contrast, several OPEC members have seemingly become unwilling to cut production and lose market share as higher-cost producers are largely responsible for the production growth. Several analysts have argued that since the decline was caused by excess supply, the current oil price curve will follow a U-shape recovery, meaning we will see a longer period of low oil prices than in the previous correction, and then a return to much higher prices again.
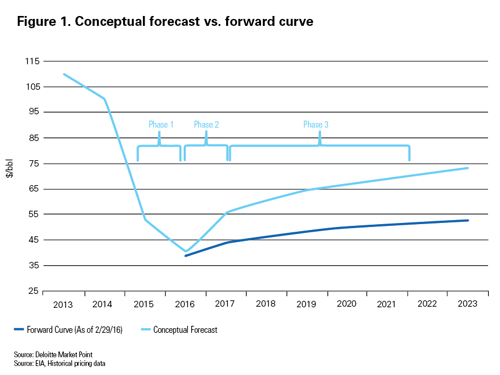
Considering today’s price environment—with many sources of crude oil at or near their “cash cost” or variable lifting cost level—one could argue that a sustained period of low prices can’t continue for long unless future demand becomes materially weaker than expected. The current oil futures market appears to represent this view; settlements (Figure 1) show prices in contango, which then flatten to a steady level of $50/barrel by 2020 and remain there for several more years. [Contango refers to a situation where the future spot price is below the current price, and people are willing to pay more for a commodity at some point in the future than the actual expected price.]
Taking a closer look at the fundamentals of oil economics, we postulate the price recovery shape could differ somewhat from what the current forward curve portrays. Figure 1 also shows a conceptual oil price outlook following a “checkmark” recovery. This curve represents the switching from current low prices (Phase 1; near cash-cost levels) to a rapid step-up (Phase 2), which boosts prices more rapidly, but not to the levels seen pre-crisis, as efficiencies have increased and production costs have been reduced.
We enter Phase 3 as increases in higher-cost elastic supply are needed to keep up with production decline and demand growth. Our analysis indicates prices could continue to gradually rise thereafter, caused by demand growth and existing production declines creating a steady contango. Given the current market data, we expect this contango to occur beyond the five-year horizon, but this is dependent on many factors.
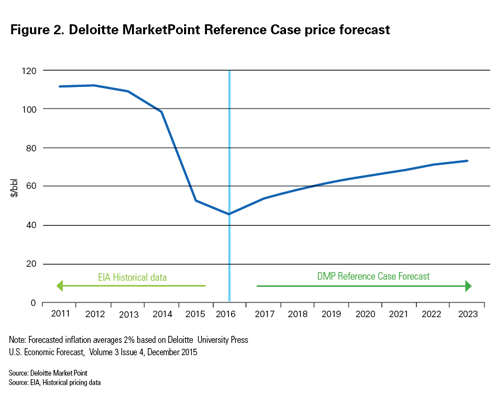 Deloitte MarketPoint’s Reference Case price forecast for the next five years (Figure 2) more resembles the “checkmark” recovery. We expect a step up in prices from the mid-$40s in 2016 to around $58/barrel in 2018 in response to the future supply-demand balance. Given the efficiencies gained, technological advances and service cost reductions achieved, U.S. tight oil production should return to some level of pre-crisis growth at these higher price levels. This shores up the production shortfall in 2018, but the larger shortfall expected in 2019 will need to be resolved by additional investment and production from Iran, Iraq, Brazil and possibly Russia—and potentially even more growth in U.S. tight oil. Beyond 2019, we expect steady price growth to support ever-increasing production requirements from more expensive sources such as offshore, oil sands and costlier tight oil projects. This could be further impacted by rising service industry cost due to increased utilization.
Conclusion
While current crude prices reflect a dire situation for much of the industry, sizeable capital and operating budget cuts over the last year are going to leave a lasting impact. We could see a supply shortfall of over one million barrels/day as early as 2018, based on delayed investments and factoring in investment carryovers and excess storage drawdowns. This shortfall should generate a much-needed price increase to around $58/barrel, but not the return of $100+/barrel oil in the near term.
Our analysis suggests sources such as the major U.S. tight oil basins, Iran, Iraq and possibly Russia could potentially cover the first two years of production shortfall at the $58/barrel price range. Beyond 2019, continued demand growth and production declines will require further price increases to cover full-cycle costs for high-cost producers such as Canadian oil sands and deep water offshore sources. iBi
This article was adapted from a report by Deloitte MarketPoint insights. To download the complete report, or for additional insights into the energy sector, visit www.deloitte.com/us/energysolutions.